Management Accounting & Business Planning
Without reliable management accounting, a company moves blindly, and planning turns into a mere wish list. In this section, I have gathered field-tested tools for financial modeling, budgeting, and strict cost control. Consider it your guide to building an accounting architecture that generates accurate numbers for fast, data-driven management decisions at every level.
Recommended Reading

Make or Buy? How to Avoid Fatal Decisions
Should you manufacture or outsource? Don't rely on full production costs. Learn how to analyze relevant costs, opportunity costs, and strategic risks correctly.

Budgeting as a Business Navigation System: From “Shackles” to Modeling
Transform your business budgeting system from a "bureaucratic nightmare" into a strategic tool. Learn how to build a Master Budget to model future success.

Costing Traps (Part 1)
Stop using accounting cost for business decisions. Learn how to identify Relevant Costs, ignore Sunk Costs, and avoid the "Death Spiral" in pricing and make-or-buy scenarios.

Plan = Model. If Not, It’s Just a Wish List
"Napkin planning" is dead. Discover why a financial model is the "digital twin" of your business that turns a wish list into a navigable map for growth.
View All in Management Accounting & Business Planning

How Your “Most Profitable” Product Might Be Killing Your Business
Why choosing the product with the highest contribution margin can actually lower your total profit. A guide to optimizing product mix using the Theory of Constraints.
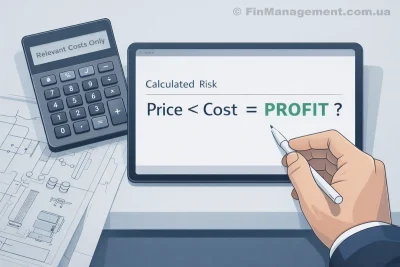
Special Orders: Should You Accept a Price Below Production Cost?
Should you accept a special order below full cost? A real-world manufacturing case study analyzing relevant costs, contribution margin, and strategic risks.
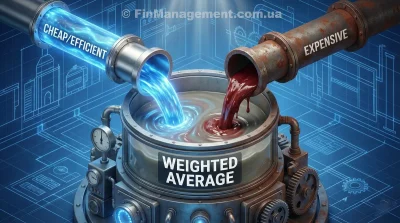
Weighted Average Cost Is a Fiction
Using Weighted Average Cost for decision-making is a dangerous trap. A real-world case study showing how mechanical accounting destroys profit and how to fix it.

Costing Traps (Part 2)
Using Weighted Average Cost (WAC) for decisions can kill your profit. A real-world case study showing why separating variable costs is crucial for sales planning.

The Ice Cream Mystery: How Not to Drown in Data
Why do ice cream sales and lifeguard rescues rise together? Discover the difference between correlation and causation in this simple data analysis guide. Learn how to spot hidden factors and avoid false conclusions.
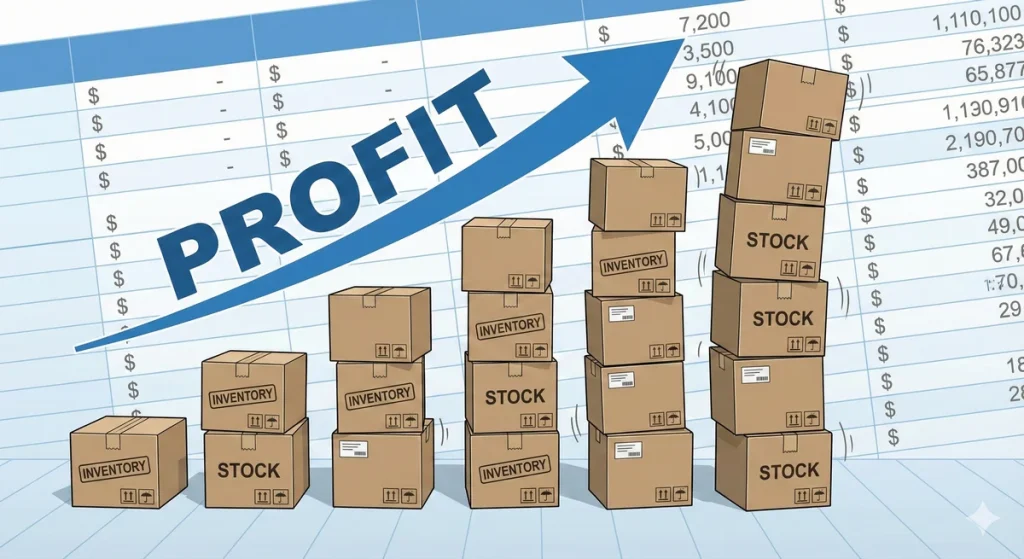
When Accounting Deceives: How Absorption Costing Distorts Profit
Why did profit go up while sales stayed flat? A detailed case study comparing Absorption Costing vs. Variable Costing. Learn how inventory build-up creates "phantom profit".

The Local Efficiency Trap: Why Total Cost-Cutting Leads to Financial Collapse
Are you in business to save money or make money? If your goal is "cost reduction," the fastest way there is liquidation. Discover why traditional accounting hides real losses and how TOC prevents financial collapse.